Dow Jones live: the most-watched market data nobody actually needs

At 9:31am ET on May 8, 2026, the Dow Jones Industrial Average ticker on MarketWatch refreshed three times in one second. By 4:00pm, it had refreshed roughly 23,400 times. The closing value was 0.43% higher than the open.
If you’d checked the Dow live at any point during those 6½ hours, you would have seen the index swing through a range of about 280 points. If you’d checked it once at 4:01pm and gone back to your life, you’d have learned the only thing that actually mattered: it closed slightly up. Most of the rest is behavioural noise, dressed up as Dow Jones live data.
Live Dow Jones tracking is the most heavily promoted, most widely consumed, and least useful financial information on the internet.
Here’s what I mean, what the data actually says about live-tracking behaviour, and the four tools I’d still use if you insisted.
The Barber-Odean number every Dow Jones live tracker should know
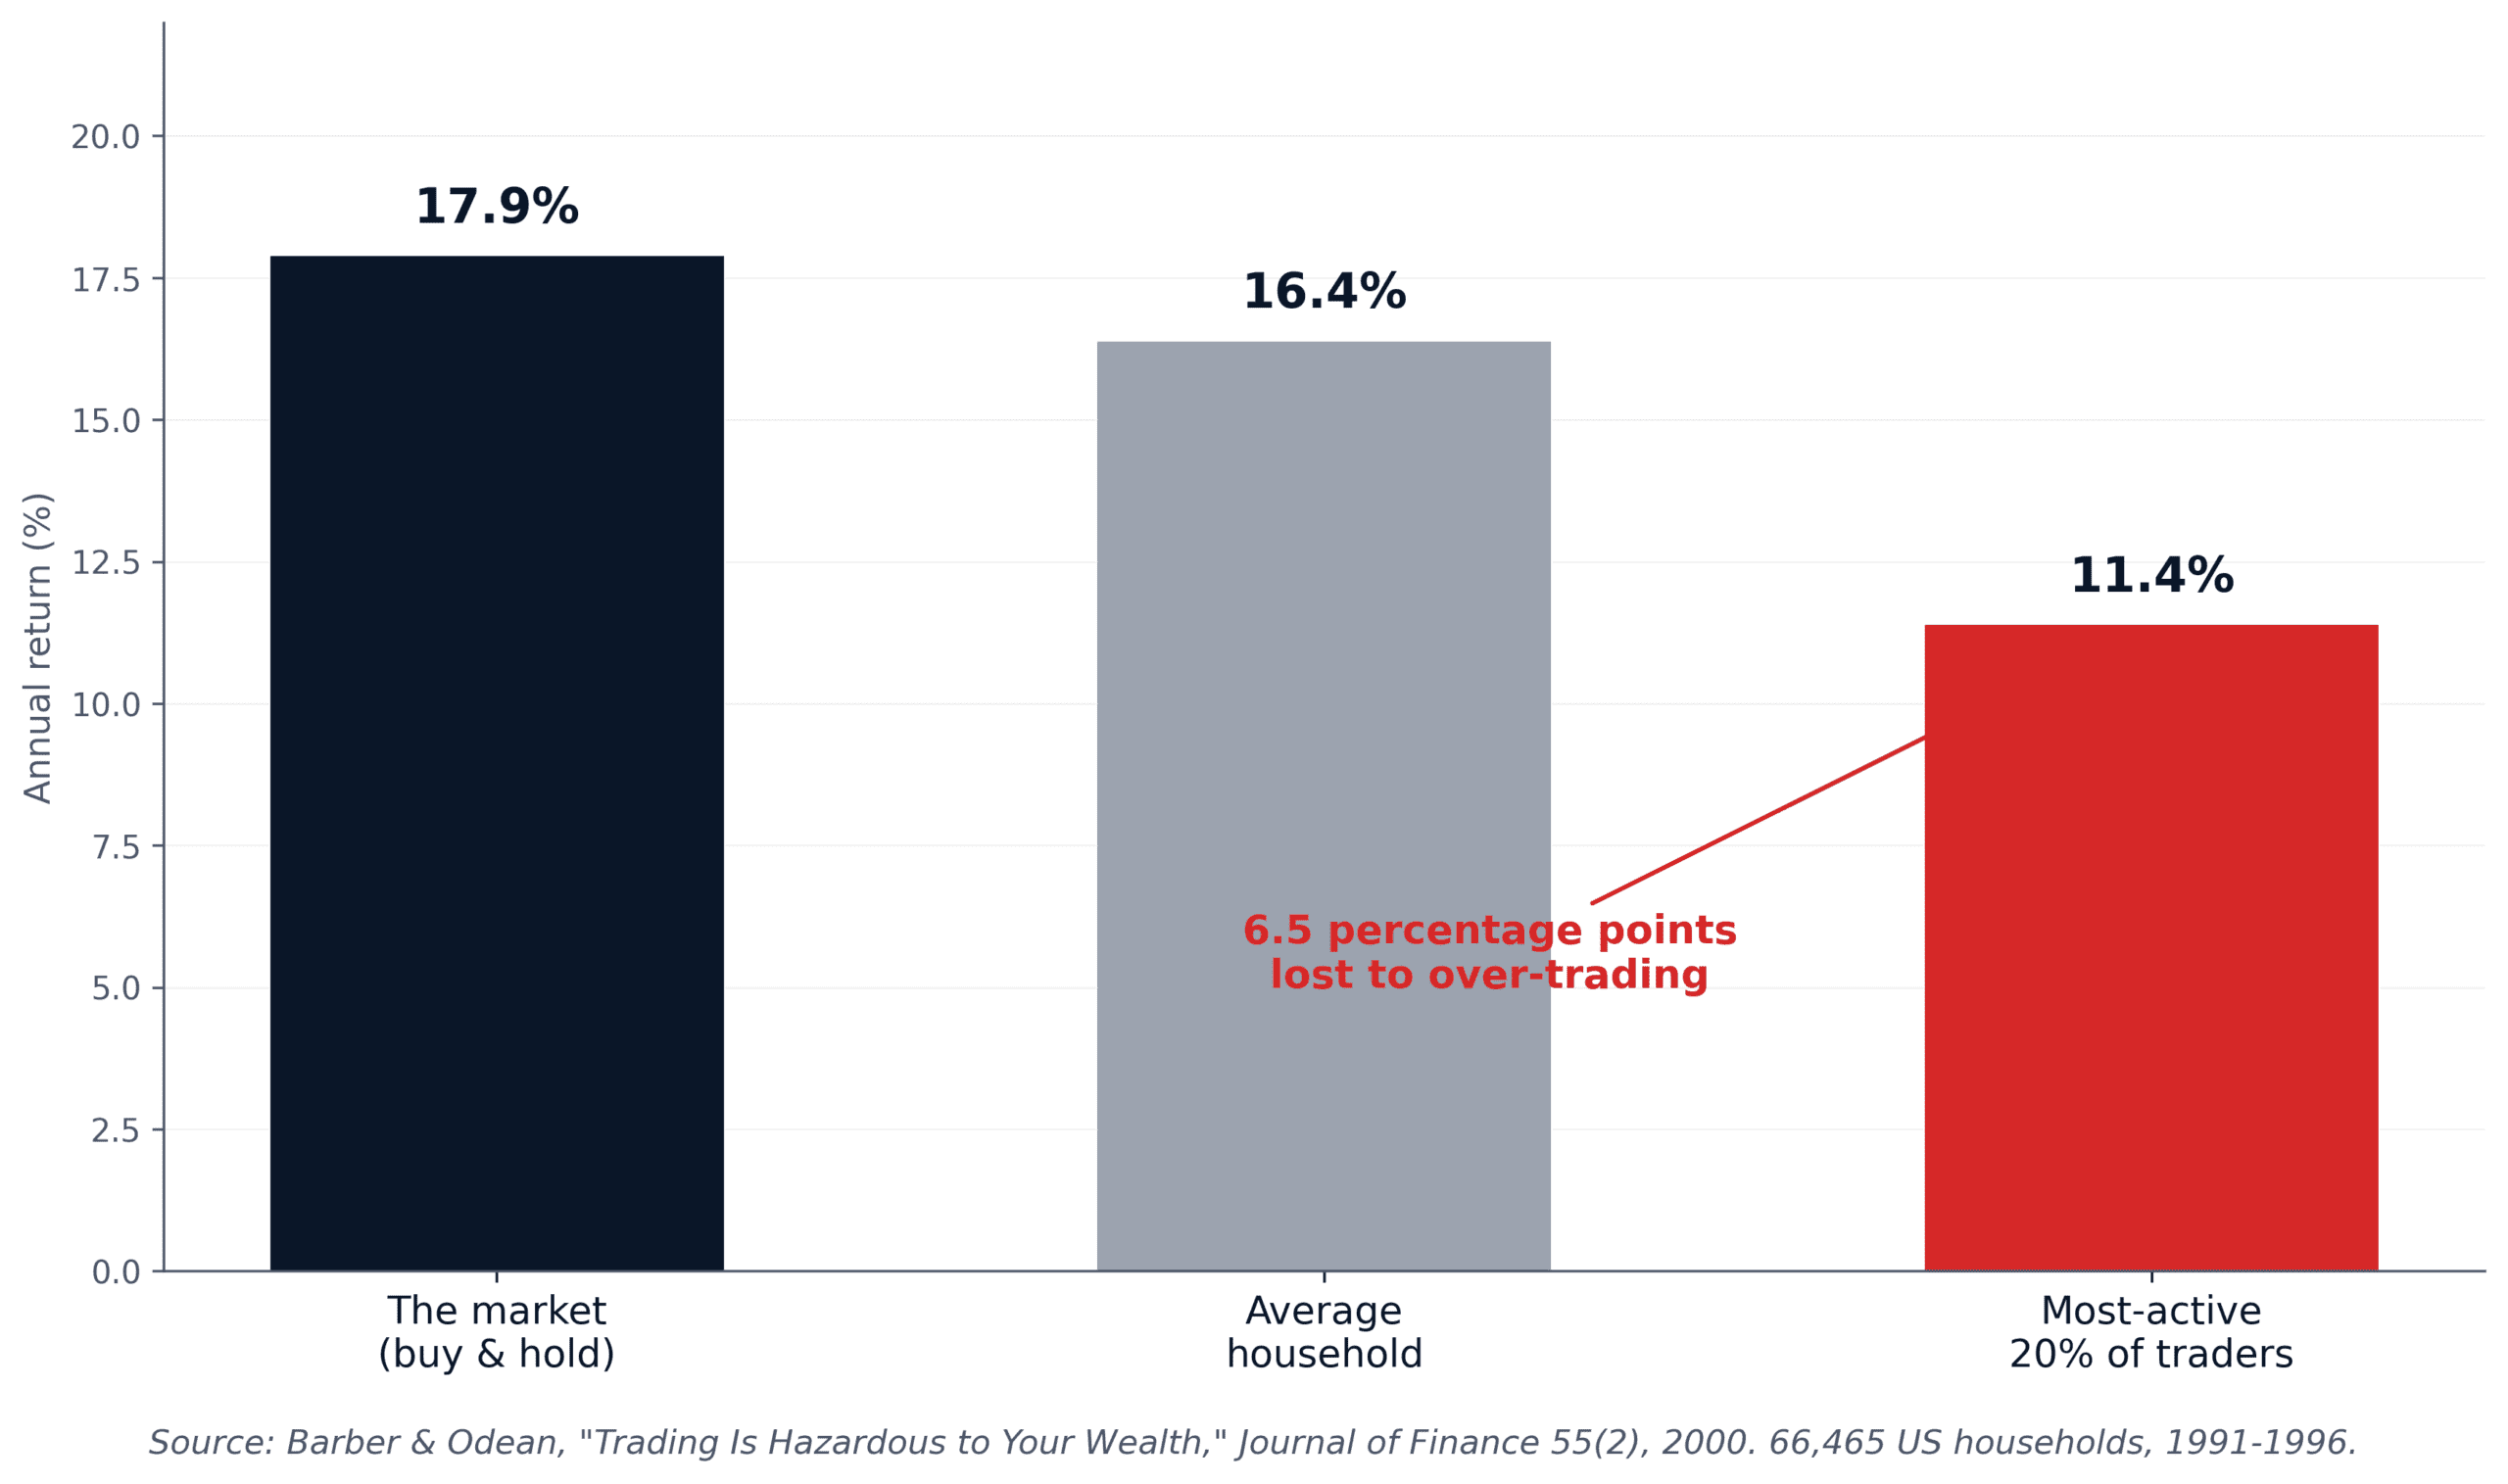
In 2000, two finance professors named Brad Barber and Terrance Odean published a paper in the Journal of Finance with one of the bluntest titles in academic history: “Trading Is Hazardous to Your Wealth.”
They studied 66,465 households at a large US discount broker between 1991 and 1996. They split them by how often they traded. Then they tracked the returns.
The result:
- The market returned 17.9% per year
- The average household returned 16.4% per year
- The most-active traders (top 20% by turnover) returned just 11.4% per year
The heaviest traders underperformed the market by 6.5 percentage points per year. Over a 30-year investing life, that gap compounds into a portfolio that’s roughly 60% smaller than it would have been if the same people had just bought and held.
Watching the Dow Jones live doesn’t directly cause trading. But it primes the brain for it. Every refresh is a small invitation to “do something.”
This is why I keep telling readers: the question isn’t “where’s the best place to track the Dow Jones live?” The question is “should I be tracking it live at all?” If you fall into the most-active 20% of investors, the answer is almost certainly costing you money. The whole behavioural-finance trap, plus how a long-horizon index investor should actually think, ties back to the lessons from 130 years of Dow Jones historical data, which makes the case that direction beats prediction every time.
What “the Dow Jones live” actually shows you (it’s not what most people think)
When a beginner first opens a Dow Jones live ticker, they assume the number reflects “how the US economy is doing right now.” It doesn’t.
A live Dow reading reflects three things in this order:
- The price of 30 hand-picked stocks, weighted not by company size but by share price. Goldman Sachs and Caterpillar drive nearly 23% of every tick. I covered this concentration math in detail in my Dow Jones ETF guide.
- Short-term sentiment: hedge fund positioning, options expiry mechanics, algorithmic trading flows, headline reactions. Most of this dissipates within hours.
- Economic reality: a distant fourth, smeared across weeks and months, never visible in any single tick.
So when CNBC says “the Dow is down 400 points on rate-hike fears,” what’s almost always actually happening is that algorithmic systems are unwinding short-term positions while two over-leveraged components (probably Goldman or UnitedHealth) are dragging the price-weighted index lower. The “rate-hike fears” narrative is a story added after the fact to make the price action feel explainable.
None of which means Dow Jones live data is fake. It just means it’s measuring something much narrower and noisier than the average viewer assumes when they open a Dow Jones live ticker.
The 4 tools to track the Dow Jones live (ranked by usefulness, not popularity)
If you’ve read this far and still want to track the Dow live (and there are legitimate reasons, like checking before a planned ETF purchase or watching during a known volatility event), here are the four tools worth using, in honest priority order.
| Tool | Ticker | Best for | Watch out for |
|---|---|---|---|
| Google Finance | .DJI | Quick check, clean interface, no ads | 15-minute delay on some data points |
| Yahoo Finance | ^DJI | Free intraday charts, component breakdown | Heavy ad load, distracting “trending” widgets |
| MarketWatch | DJIA | Real-time data with news context | Editorial spin on every tick, anxiety machine |
| TradingView | DJI | Serious charting, indicators, mobile apps | Tempts you into thinking you’re a trader |
Google Finance is what I use when I genuinely need a quick read. Type “dow jones” into Google search and the snippet appears at the top of the results with no ads, no narrative, no fear-bait headline. For a 5-second check, nothing beats it.
Yahoo Finance is the upgrade if you want to see which of the 30 Dow components are moving the index. Free, fast, and the component table tells you the real story (e.g. “the Dow is down because Goldman dropped 3%, not because the economy is collapsing”).
MarketWatch is what most “dow jones live” Google searches land on. It’s accurate, but it’s also engineered to make you feel something on every refresh. Use it sparingly.
TradingView is the serious option. If you’re using TradingView to “track the Dow live,” you’ve probably crossed from “investor” to “amateur trader,” which is the exact transition the Barber-Odean data warned against.
The 90-second rule: how often you should actually check the Dow Jones live
Here’s a rule of thumb that works for almost every long-term investor:
Check the Dow once at market close, for no longer than 90 seconds, no more than once a week.
That sounds extreme. It isn’t. Three reasons.
One, the math from H2 #1: the more often you watch, the more likely you are to act, and the more you act, the worse you do. The “do something” instinct is the most expensive bias in retail investing.
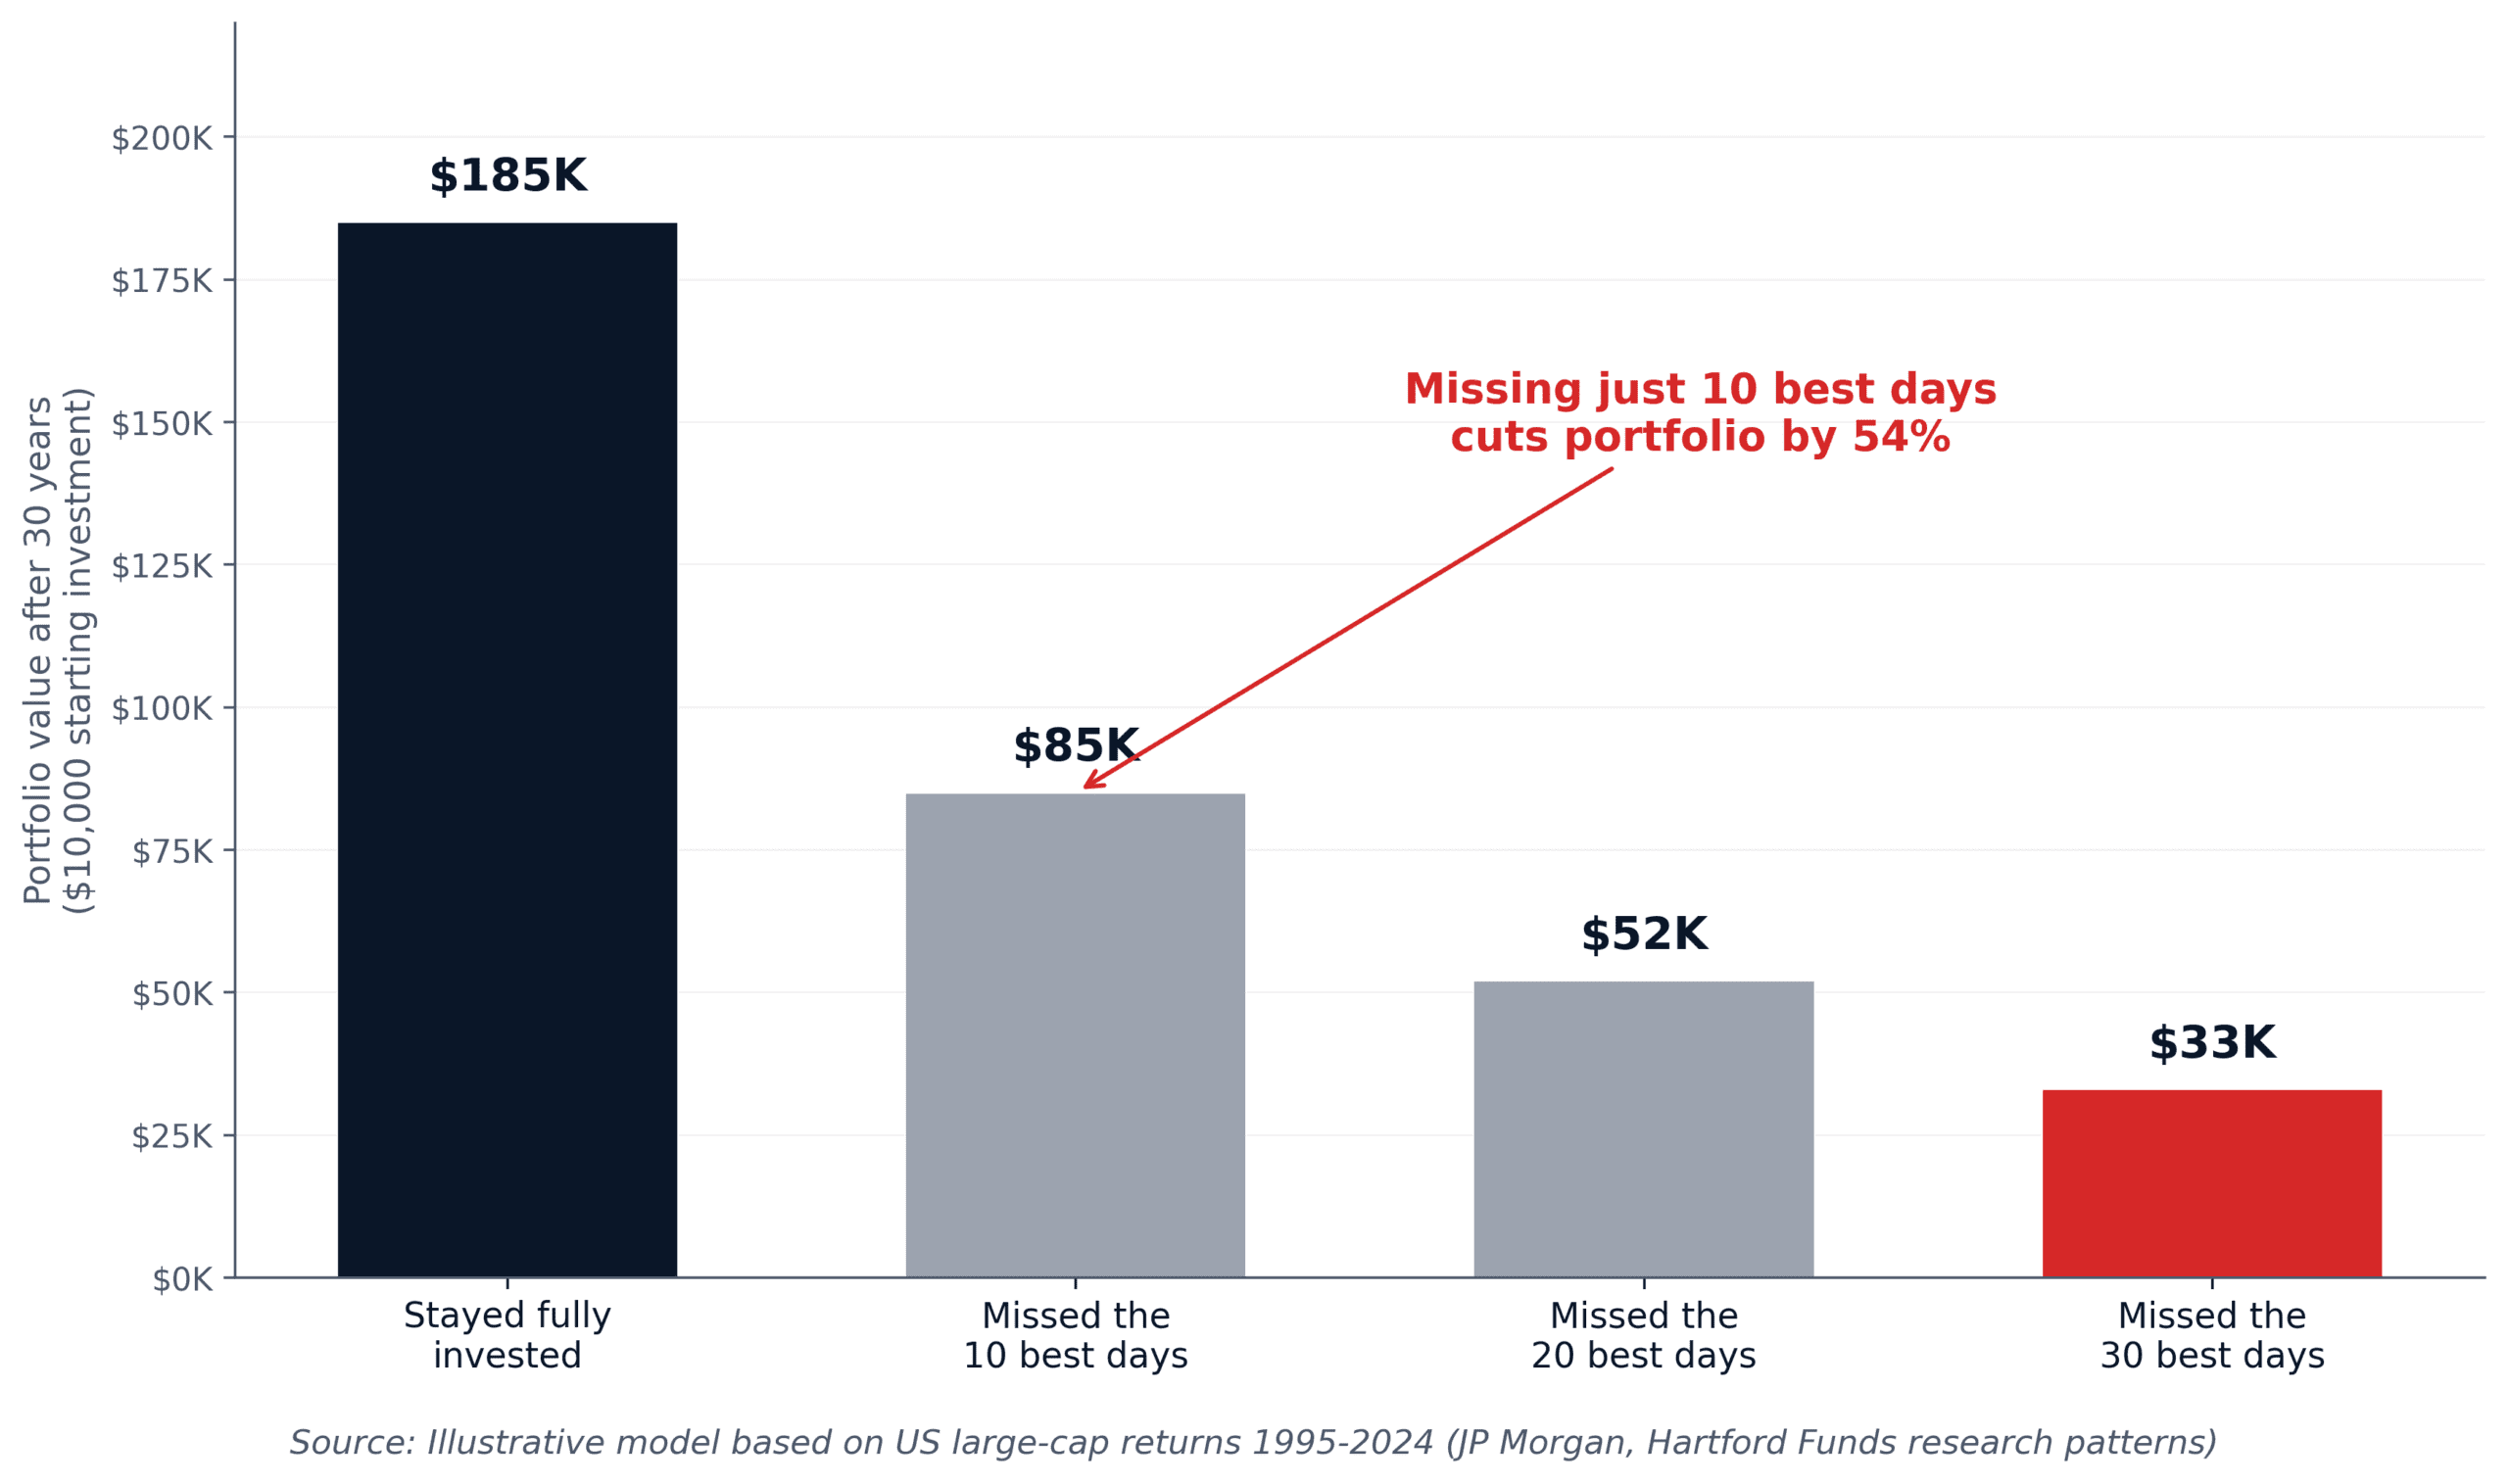
Two, the Dow’s daily moves rarely matter. Over the past 50 years, the index has had roughly 12,500 trading days. The 10 best and 10 worst days are responsible for an enormous share of the total return. Missing the 10 best days would have cut your long-term return by more than half. You can’t predict which 10 they’ll be. You can only stay invested through all 12,500.
Three, attention is a finite resource. Every minute spent watching a Dow Jones live ticker is a minute not spent earning, saving, learning a skill, or building something that actually compounds. Most retail investors who lose money on the market don’t lose it from one bad trade. They lose it slowly by paying attention to noise. There’s a similar mechanics-vs-noise discussion in my $25 little money plan: the people who actually grow $25 a week into something meaningful aren’t watching tickers, they’re automating contributions.
When tracking the Dow Jones live actually makes sense
I’m not absolutist. There are three real situations where watching the Dow live is reasonable, not pathological.
One: you’re about to place a large ETF order. Checking the live Dow level 30 seconds before pressing buy makes sense, especially around the open or close when bid-ask spreads matter. This is “watching for execution,” not “watching for emotion.”
Two: a scheduled high-impact event. Fed announcement days, jobs report days, major earnings releases from Dow components: these are the few moments when intraday Dow movement actually contains usable signal. Even then, watching is for context, not for trading.
Three: you’re a professional or semi-professional trader. If your full-time job is moving capital, ignore everything I’ve said. This post isn’t for you. It’s for the 95% of people who hold an index ETF for retirement and accidentally check their phone 40 times a day during a bad market week.
For everyone else, the Dow Jones live ticker is to your portfolio what the bathroom scale is to your weight loss: technically real data, almost always counterproductive, designed to make you do something you’d otherwise have the sense not to.
Here’s what I’d actually do
Turn off the ticker. Delete the app. If you want a market check, do it once a week, on a Friday after close, for 90 seconds. Look at the number, note whether it went up or down, then go cook dinner.
If you want exposure to the Dow without the obsession, buy DIA (or DJD if you prefer the dividend tilt) inside a tax-advantaged account, set up an automatic monthly contribution, and forget the ticker exists for the next decade. The full mechanics of which Dow Jones ETF to use are in my VTI vs VOO comparison.
The Dow will close higher than today on most of the days that matter. It will close lower on most of the days that don’t. Live Dow Jones tracking can’t tell those apart in real time. Only hindsight can.
So save your hindsight for the rare moments when it earns its keep, and stop spending it on a number that updates 23,000 times before lunch.
Sources
- Brad M. Barber and Terrance Odean, “Trading Is Hazardous to Your Wealth: The Common Stock Investment Performance of Individual Investors,” Journal of Finance 55(2), 2000, wiley.com
- SEC EDGAR, SPDR Dow Jones Industrial Average ETF Trust NPORT-P, January 31, 2026, sec.gov
- Morgan Stanley Wealth Management, “Behavioral Finance in the Markets: Identify Bias” (2025), morganstanley.com
- S&P Dow Jones Indices, Dow Jones Averages Methodology (2025), spglobal.com
- Federal Reserve Bank of St. Louis, FRED database, DJIA series (2026), fred.stlouisfed.org
Arpit Soni
The Thewealthora desk covers markets, money and personal finance, with zero jargon and every claim sourced.