

Stock market movers: what is pulling the index today
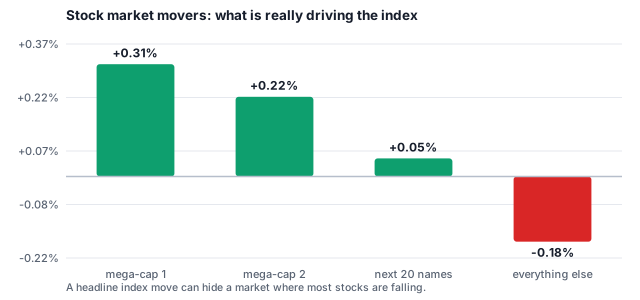
These stock market movers show which constituents are actually driving an index, ranked by how hard each one is pulling. The S&P 500 is up 0.4 per cent, but is that 400 stocks quietly rising, or two giant tech names dragging everyone along? Pick a US index and see every name we track, with its percentage move and the same move in dollars beside it: over a hundred for the S&P 500, all thirty Dow members, and the Nasdaq 100 heavyweights. Breadth data like this usually hides inside paid terminals.
What is the stock market movers board?
Market breadth measures how many stocks are actually participating in a move. Because major US indexes are weighted by company size, a 2 per cent move in a three-trillion-dollar company can outweigh dozens of smaller decliners, so the index can rise while most shares fall. This tool makes that hidden tug-of-war visible by ranking the constituents themselves, so you can see the handful of names carrying a rally and the far longer list sinking quietly underneath it, weighted toward the members that dominate each index's weighting.
How the stock market movers board works
How to use it
- Pick an index: S&P 500, Dow Jones or Nasdaq 100.
- Read the two counts at the top: how many members are rising, and how many are falling.
- Scroll either column for the full ranked list, biggest mover first, with each percentage and dollar move.
- Check the breadth bar for a broad move versus a narrow one.
Good to know before you rely on it
- Breadth is a context tool, not a buy or sell signal. A narrow rally can run for months before it matters.
- The Dow tab is the complete index, all thirty members. The S&P and Nasdaq tabs carry the heaviest-weighted names rather than every constituent, because those are the ones that actually move the number.
- Compare breadth across the three indexes: the Dow, Nasdaq and S&P can tell very different stories on the same day.
- Outside US trading hours the figures are the last close, so treat an overnight reading as yesterday's picture.
Why Thewealthora’s stock market movers board is different
- Turns a single index percentage into the real story underneath it.
- Live during US hours, and the last-close picture outside them.
- The same honest feed that powers the rest of the site, no fabricated ticks.
Pair it with the currency converter, the compound interest calculator, or open live markets and our investing guides.
Sources and further reading
For the underlying concepts, see S&P Dow Jones Indices methodology.
Frequently asked questions
What does market breadth mean?
Breadth measures how many stocks are participating in a move. If an index rises while most of its members fall, the gain is being carried by a few mega caps, a narrow and more fragile rally. When most members rise together the move is broad, and typically healthier.
Which stocks does this tool track?
Around a hundred real index constituents. The Dow Jones tab is the complete index, all thirty members. The S&P 500 and Nasdaq 100 tabs show the most heavily weighted members rather than every single name, because index weightings are dominated by those companies and they explain the bulk of every daily move.
Why is the index up when most stocks are down?
Major US indexes are weighted by company size, so a large move in a giant company outweighs many small decliners. This tool makes that invisible tug-of-war visible, showing exactly who is doing the lifting.
How fresh is the data?
Prices refresh every minute during US trading hours from the same live feed that powers the rest of Thewealthora. Every percentage is measured against the previous close for that same stock, which is the base your broker app uses, so the two figures agree. Outside market hours the tool shows the picture as of the last close.
This tool is for education, not personalised financial advice. Results are projections based on your inputs, not guarantees.
More free tools
Keep going: check live stock market prices, read our investing guides for beginners, or catch up on today's finance news.