The 10-year Treasury yield just hit 5.3%. Half of it isn’t the deficit
The 10-year Treasury yield hit 5.3%, the highest since 2002. The Fed's own term premium data shows the deficit explains under half the move.


On 15 September the 10-year Treasury yield closed at exactly 5.00%. Thirteen trading sessions later it closed at 5.31%, the highest since April 2002, and touched roughly 5.35% intraday before buyers showed up.
Almost every explanation published this week blames the deficit. Washington borrows too much, lenders demand more to fund it, yields go up. It is a tidy story, and it is almost always repeated without a single number attached to it.
The Federal Reserve publishes that number. It says the deficit explains less than half of what happened to the 10-year Treasury yield this year. The bigger half is something else, and it points to a very different set of decisions for anyone with a mortgage application open or cash sitting in a savings account.
What the 10-year Treasury yield actually did in five weeks
The 10-year Treasury note is the loan the US government takes out for a decade. Its yield is the annual return a buyer locks in by holding it to maturity. When people say “the 10-year,” this is the thing they mean, and most borrowing costs in the rich world are priced off it.
Here is the actual path of the 10-year Treasury yield, taken from the Treasury’s own daily par yield curve rather than a headline.
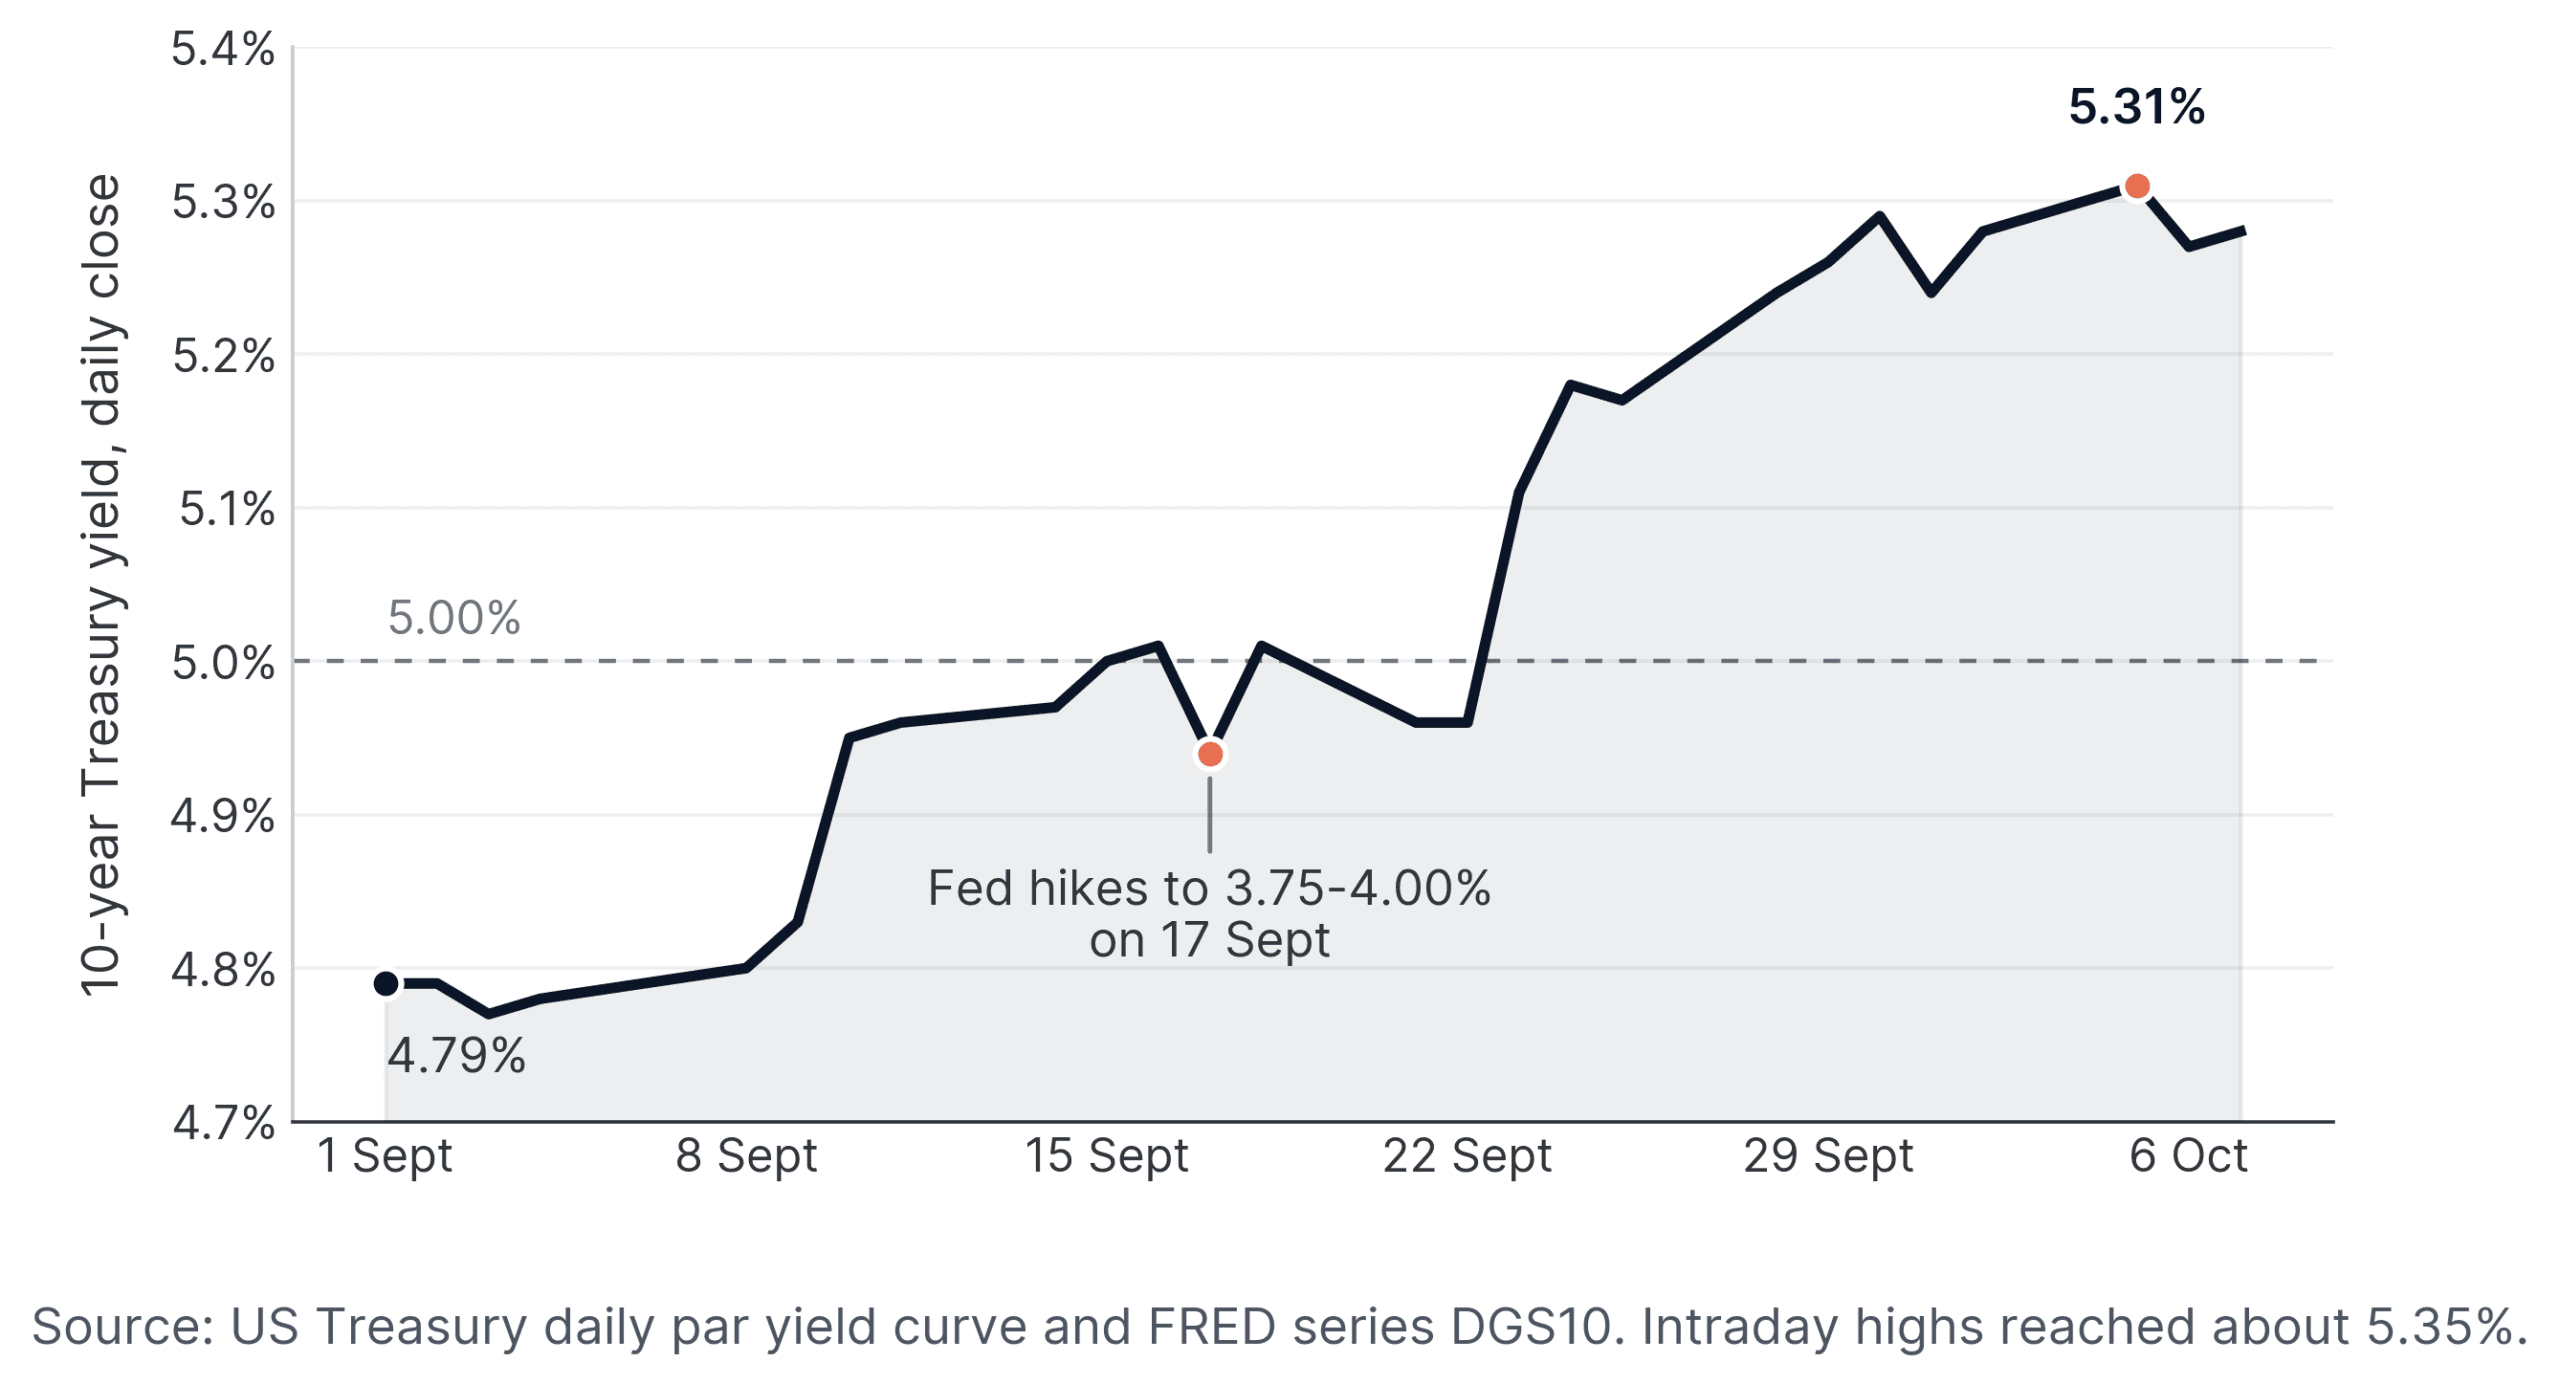
On 1 September the 10-year Treasury yield was 4.79%. By 5 October it closed at 5.31%. That is 52 basis points in five weeks, where a basis point is one hundredth of a percentage point.
One detail is worth getting right, because a lot of the coverage has fudged it. The 5.3% figure is an intraday high plus a single official close of 5.31% on 5 October. The Treasury’s closing par yield on 7 October was 5.28%. The headline is true, but the number in the official data is a little lower than the one in the headlines, and if you are making a decision on it, use the close.
Why half the move has nothing to do with the deficit
The 10-year Treasury yield, like any long-dated bond yield, splits into two parts, and they have almost nothing to do with each other.
The first is rate expectations: what traders think the Fed’s overnight interest rate will average over the next ten years. The second is the term premium, the extra compensation a buyer demands purely for committing money for a decade instead of rolling it over month by month.
Think of a phone plan. Month-to-month costs more per month than a two-year contract, because the network is paying you for flexibility and you are charging it for the risk of being locked in. The term premium is that lock-in charge, applied to lending money to the US government for ten years. When people say the deficit is driving yields, the term premium is the only part of the 10-year Treasury yield they could possibly mean.
The Fed publishes a daily estimate of it, the Kim-Wright model, as FRED series THREEFYTP10. Almost nobody covering this story quotes it. Here is what it shows for 2026.
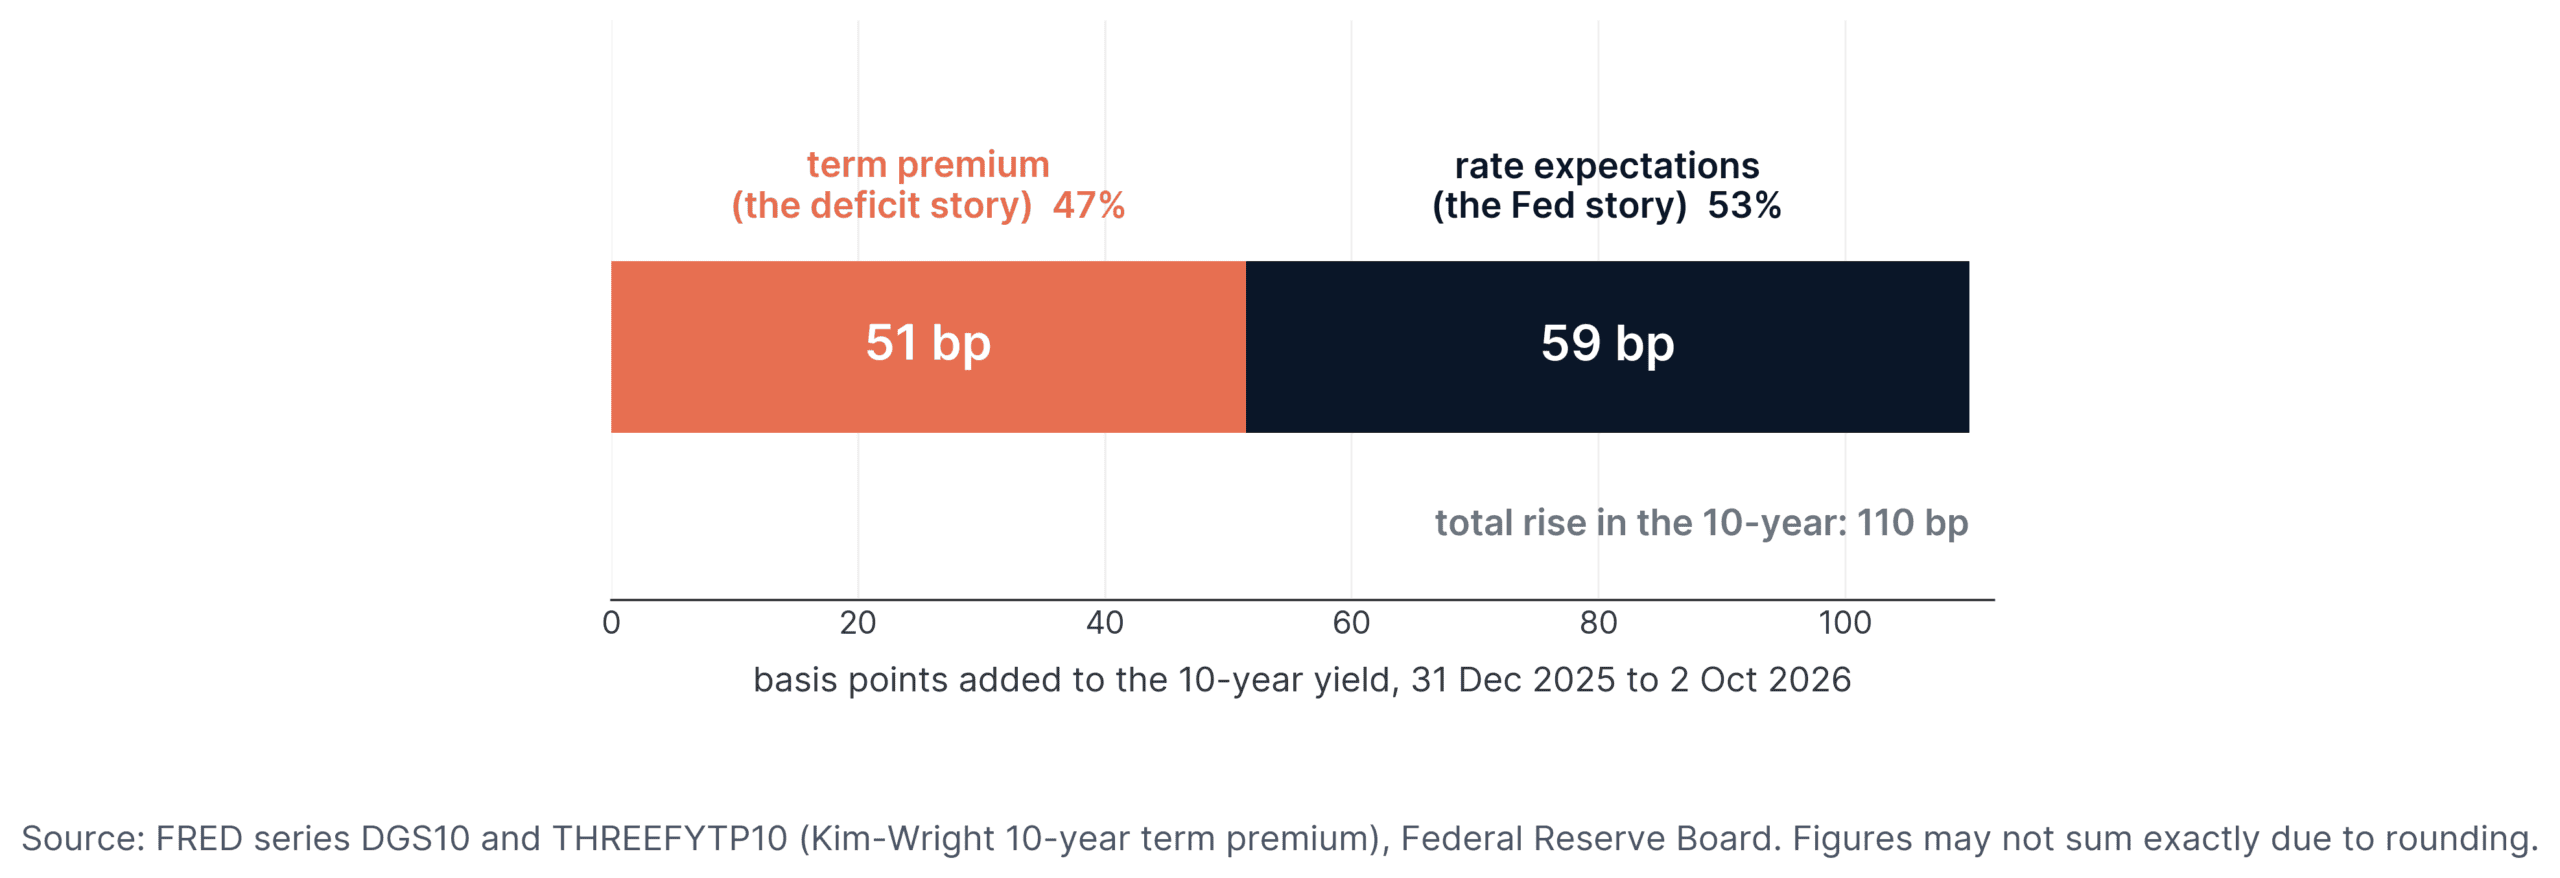
Over 2026 the 10-year Treasury yield rose 110 basis points, from 4.18% on 31 December to 5.28% on 2 October. The term premium rose 51 basis points of that, from 0.57% to 1.08%. The deficit explanation accounts for 47% of the move. The other 59 basis points is the market changing its mind about the Fed.
This is not a technicality. The two halves imply opposite trades. If the whole move were fiscal, long bonds would be the problem and short bonds the refuge. If most of it is the Fed, the short end is where the repricing bites and the long end is partly cheap.
I should be straight about the limits. Term premium is a model output, not an observation, and the two main models, Kim-Wright and the New York Fed’s ACM, can disagree by 30 basis points or more on the level. What they rarely disagree on is direction and rough size, and 51 out of 110 is not a close call.
The 2-year says the Fed is going the other way
On 17 September the Fed raised its target range to 3.75% to 4.00%. Not cut. Raised. Consumer inflation was running at 3.35% in the year to August, well above the 2% target, and oil has done the Fed no favours since.
Now look at what the rest of the curve is doing relative to that.
| Maturity | Yield, 7 Oct 2026 | Above Fed midpoint | What it is pricing |
|---|---|---|---|
| 2-year | 4.77% | +90 bp | Roughly three or four more hikes |
| 10-year | 5.28% | +141 bp | Those hikes plus a 1.08% term premium |
| 30-year | 5.67% | +180 bp | Mostly the borrowing, this is the fiscal end |
The Fed’s midpoint is 3.875%. A 2-year note yielding 4.77% is a bet that the average overnight rate across the next two years sits about 90 basis points above today’s. You cannot get an average that far above the current rate without several more hikes inside it.
So the 10-year Treasury yield at 5.3% is not one story. It is a fiscal story at the 30-year end and a monetary policy story at the 2-year end, meeting in the middle of the curve.
What a 5.3% 10-year Treasury yield does to your mortgage
This is the part that touches most people, and there is a clean relationship hiding inside it.
Lenders price 30-year fixed mortgages off the 10-year Treasury yield, then add a spread for the risk that you repay early or not at all. The useful question is whether that spread is stable, because if it is, you can forecast your own mortgage rate from a number published every afternoon.
It has been remarkably stable. On 31 December 2025, Freddie Mac’s survey put the 30-year fixed at 6.15% against a 10-year at 4.18%, a spread of 197 basis points. On 1 October 2026 it was 7.28% against 5.24%, a spread of 204 basis points. Mortgage rates rose 113 basis points this year while the 10-year rose 110. They tracked it almost exactly one-for-one.
On a $400,000 thirty-year loan that is the difference between $2,437 and $2,737 a month. Three hundred dollars, every month, for thirty years. In the UK the transmission is slower, because fixes run two or five years and price off swaps rather than Treasuries, but gilt yields have moved on the same global tide, and anyone rolling off a 2021 fix meets all of it at once.
Should you lock now? Nobody can answer that for you, but the spread stability tells you something useful. If you are waiting for mortgage rates to fall, you are really waiting for the 10-year Treasury yield to fall, and that mostly means waiting for the Fed to stop hiking. Watch the 2-year, not the headlines about the deficit.
Why your savings account did not get the memo
A reasonable reader sees 5.3% and asks why their instant-access account still pays three-point-something.
Deposit rates track the short end, not the 10-year. Your bank prices your savings against what it can earn overnight, which is the Fed’s 3.75% to 4.00%, minus whatever margin it thinks you will tolerate. A 5.3% 10-year Treasury yield does not put 5.3% in your savings account, and it never has.
To get the 5.3% you have to buy the actual bond, through TreasuryDirect, a broker, or a Treasury ETF. The catch is duration risk: if the 10-year Treasury yield rises another 50 basis points, the market value of a 10-year note falls roughly 4%. You only bank the yield by holding to maturity. Tokenised versions of the same trade have grown quickly too, and I went through what you can and cannot actually buy in this piece on on-chain government bonds.
The maths that makes shares harder to justify
A 10-year Treasury yield of 5.3% is the hurdle every other asset has to clear. It is the return available without doing anything clever, and in nominal terms it is guaranteed.
Run the comparison. The S&P 500 closed September near 7,650. On consensus forward earnings the index has been trading around a 4.3% earnings yield, which is the inverse of its price-to-earnings ratio and roughly what each dollar invested earns you in company profit. When the 10-year Treasury yield is 5.28% and the equity earnings yield is 4.3%, you are being paid about a percentage point less to take all of the risk.
That is not a sell signal. The gap has been negative before and shares kept rising for years. What it does mean is that the margin for error has gone, and the most rate-sensitive things get hit first: long-duration growth stocks, REITs, utilities, and anything bought mainly for its yield. If you hold shares for the dividend, the income case deserves a fresh look when a Treasury pays more than your dividend yield with none of the drawdown risk.
It also matters which index you own, because the concentration in the US large-cap benchmarks sits exactly where rate sensitivity is highest, something I worked through in the VTI vs VOO breakdown.
What actually changes for you this week
Not much, if you are honest about it, and that is the uncomfortable part.
The last time the 10-year Treasury yield sat here was 2002. Anyone who sold shares then because bonds finally looked better missed one of the longest bull markets on record, which is the sort of lesson 130 years of Dow data keeps teaching people who will not listen.
Three things are genuinely actionable. If you are buying a house, your rate is now forecastable from a public number, so watch the 10-year Treasury yield and the 2-year rather than lender marketing. If you hold a long-dated bond fund, check its duration, because a fund carrying 14 years of duration loses roughly 14% of its value for every extra percentage point of yield. And if your cash is earning 3%, the gap between that and a Treasury is now wide enough to be worth the paperwork.
I got this wrong in 2023. I treated a 5% 10-year as a ceiling, extended duration early, and spent eighteen months underwater on the position that was supposedly the safe one. A high yield is not the same thing as a peak yield.
The deficit will still be there in 2027. The Fed will have made up its mind by then, and that is the half of this move that will actually tell you when it is over.
Sources
- US Department of the Treasury, Daily Treasury Par Yield Curve Rates, October 2026 – home.treasury.gov
- Federal Reserve Bank of St Louis, FRED series DGS10 and THREEFYTP10 (Kim-Wright term premium) – fred.stlouisfed.org
- Board of Governors of the Federal Reserve System, FOMC statement, 17 September 2026 – federalreserve.gov
- Freddie Mac, Primary Mortgage Market Survey, 1 October 2026 – freddiemac.com
- US Bureau of Labor Statistics, Consumer Price Index, August 2026 – bls.gov
- Congressional Budget Office, Budget and Economic Outlook 2026 to 2036 – cbo.gov

Arpit Soni
Founder and Editor in Chief
Thewealthora was started to do one thing: take the money questions people actually ask and answer them in plain English, with the arithmetic shown and the catch stated rather than buried.