Bitcoin 50-week EMA breakout signals shift in trend
Bitcoin closes above its 50-week EMA for the first time since late 2025 ahead of the Jackson Hole symposium.

Key Takeaways
- Bitcoin has reclaimed its 50-week EMA, a technical milestone not seen since late 2025
- The move suggests potential momentum shift as markets await Jackson Hole policy signals
- Moving averages help traders spot trend changes and areas of support or resistance
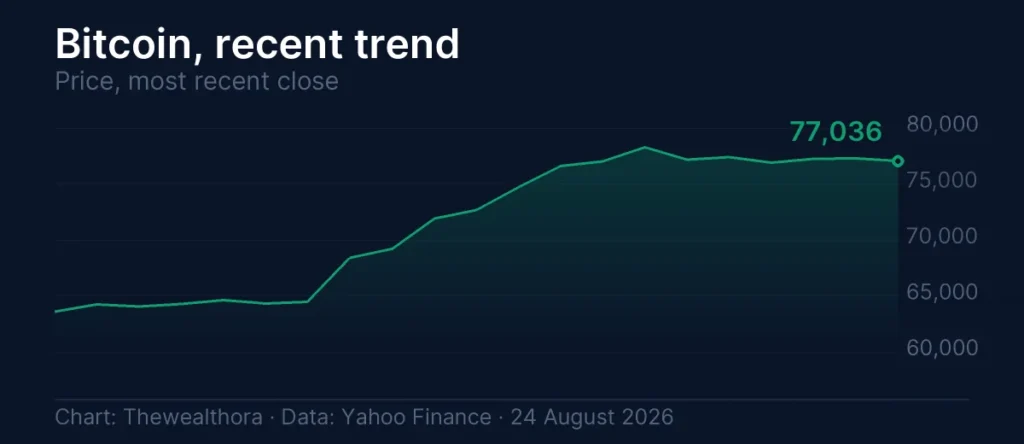
Bitcoin closed a weekly candle above its 50-week EMA for the first time since late 2025, according to Cointelegraph, marking a potential technical turning point as global markets prepare for this week’s Jackson Hole Economic Symposium.
The 50-week EMA (exponential moving average) is a line that traders draw across a price chart to smooth out noise and spot the underlying trend. When Bitcoin trades above it, it historically suggests bullish momentum; below it, bearish pressure.
| Bitcoin milestone | Closed above 50-week EMA for first time since late 2025 |
|---|---|
| Data source | Weekly candle close, monitored by Cointelegraph |
| Market timing | Breakout coincides with Jackson Hole Economic Symposium week |
Why the Bitcoin 50-week EMA breakout matters now
This breakout is noteworthy because Bitcoin had not closed above this level since the tail end of 2025. For a chart-watching trader, reclaiming this line is like a stock recovering above a psychological resistance point that had been holding it down for months.
The timing is not random. The Jackson Hole symposium, held annually by the U.S. Federal Reserve, hosts central bankers and economists discussing economic outlook and policy direction. Comments from Fed officials during the event can move asset prices sharply, and crypto markets are watching closely for any signals about interest rates or financial conditions.
Bitcoin’s move above the Bitcoin 50-week EMA suggests institutional and retail traders may be positioning for a shift in sentiment heading into this event. Whether that shift holds depends largely on what policymakers say and how markets interpret their tone.
What technical levels mean and why traders watch them
Moving averages are not magic forecasting tools. They are simply mathematical averages of past prices plotted on a chart to reveal whether an asset is in an uptrend, downtrend or chop.
The 50-week EMA sits between shorter-term moving averages (which react quickly to price swings) and longer-term ones (which shift slowly and represent the truly dominant trend). This makes it a favourite for traders trying to catch medium-term momentum without getting whipsawed by daily noise.
When Bitcoin trades above its Bitcoin 50-week EMA consistently, it tells other traders that buyers have the upper hand. When it trades below, sellers are in control. A close above this level for the first time in months can trigger a cascade of buying as traders who were waiting for this exact signal decide to enter positions.
Does one weekly close guarantee a new bull run?
No. One candle close, no matter how significant, does not confirm a sustained trend. Bitcoin could drop below the Bitcoin 50-week EMA next week if bad news arrives or if institutional traders take profits. Technical levels matter, but they are only meaningful when multiple factors align: volume, market sentiment, macroeconomic conditions, and regulatory signals all play a role.
What this means for you
Whether you hold Bitcoin, trade it, or simply follow crypto markets, understanding what traders mean by technical breakouts helps you make sense of price moves without getting swept into hype.
- If you already own Bitcoin or crypto holdings, this breakout above the Bitcoin 50-week EMA does not guarantee further gains, but it does suggest momentum is shifting. Monitor whether Bitcoin holds this level over the next few weeks rather than acting on one day’s move.
- If you are considering entering a position, wait to see if the Bitcoin 50-week EMA level holds after Jackson Hole. Technical traders call this confirmation, and it often arrives over multiple weeks, not days.
- If you do not hold crypto but follow markets, note that crypto traders and institutional funds now have a chart-based reason to stay bullish. If this level breaks, sentiment could shift just as quickly in the opposite direction.
Thewealthora’s guides to cryptocurrency investing and technical analysis go deeper into how to read charts and build a crypto strategy that fits your goals and risk tolerance.
More on Bitcoin 50-week EMA from Thewealthora
- Crypto D&O insurance coverage gets explicit clarity from Corgi
- Bitcoin price forecast: Bitget CEO expects trading range at year-end
- Bitcoin treasury breakeven as price hits $77K
- Crypto phishing campaign targets 885,000 phone numbers
More stories like this on the Finance Wire.
Originally reported by Cointelegraph. Facts verified; analysis and wording are Thewealthora’s own.

Ethan Caldwell
Executive Editor, Markets
Ethan Caldwell is Executive Editor of Thewealthora's Finance Wire, the desk that carries this site's fast coverage of US equities, corporate earnings, central bank decisions and the macro calendar.